Options Order Flow: What Every Trader Must Know

Options Order Flow: What Every Trader Must Know
Options order flow is the real-time record of every options trade executed in the market, encoding who is trading, how aggressively, and with what directional conviction. Retail price charts show you what happened. Order flow tells you who made it happen and why. Institutional traders move markets before price confirms the move, and their fingerprints appear first in the flow. Mastering options order flow gives you an informational edge that no candlestick pattern can replicate. This guide breaks down the core metrics, the critical distinctions, and the practical filters that separate signal from noise.
What is options order flow and why does it matter?
Options order flow is defined as the live stream of executed options trades, each carrying data about size, aggression, strike, expiration, and premium paid. Unlike a price chart, which only records where a stock traded, order flow encodes directional conviction, time horizon, risk tolerance, and urgency in a single print.
Institutional traders, the funds and desks moving hundreds of thousands of dollars per trade, cannot hide their activity from the flow. When a fund buys 2,000 call contracts at the ask across multiple exchanges in under a second, that aggression is visible. The flow captures it before the stock moves a dollar.

The standard industry term for this practice is order flow analysis, and it sits at the intersection of market microstructure and options strategy. Traders who understand it stop reacting to price and start reading intent. That shift is the real edge.
What are the key metrics and signals in options order flow?
Every print in the flow carries several data fields. Reading them correctly separates useful signals from noise.
Trade aggression is the most immediate signal. Execution price relative to bid-ask tells you who initiated the trade and how urgently. The four aggression codes work as follows:
-
Above Ask (AA): Buyer paid more than the ask. Extreme bullish urgency.
-
At Ask (A): Buyer hit the ask. Standard bullish aggression.
-
At Bid (B): Seller hit the bid. Standard bearish aggression.
-
Below Bid (BB): Seller accepted less than the bid. Extreme bearish urgency.
AA and A prints signal buying pressure. B and BB prints signal selling pressure. The distinction matters because a large call purchase at the bid is not bullish. It is likely a closing trade or a hedge.
Volume-to-Open Interest ratio (Vol/OI) tells you whether a trade opens new positioning or closes existing exposure. A Vol/OI ratio above 5x on a strike with low prior open interest means fresh money is entering. A high-volume print on a strike with massive existing OI likely represents rolling or closing, not a new directional bet.
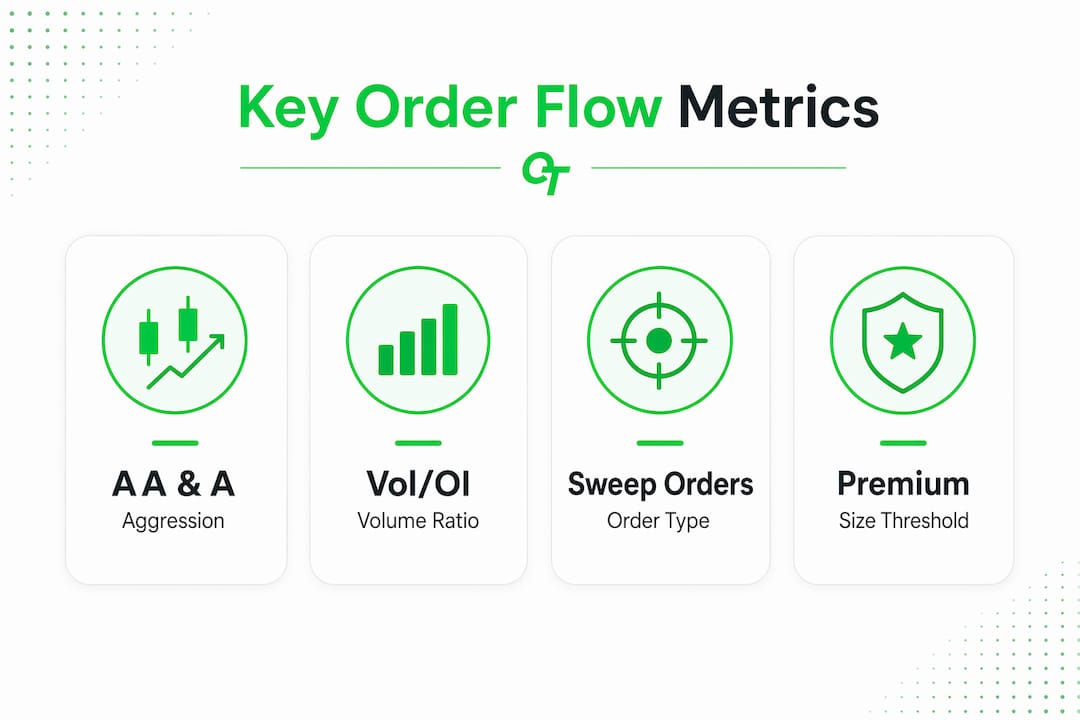
Flow type is the third critical variable. Sweep orders aggressively cross multiple exchanges for immediate fill, signaling urgency and high conviction. Block orders are single, negotiated fills, indicating planned positioning over urgency. A sweep on a near-term call strike reads very differently from a block on the same strike.
Premium size thresholds filter retail noise from institutional activity. A premium floor above $175,000 combined with a Vol/OI ratio above 5x and a DTE window of 7–45 days effectively isolates institutional directional trades. Below that threshold, the signal-to-noise ratio drops sharply.
Pro Tip: Set your flow scanner to filter for AA and A aggression only, premium above $175,000, and Vol/OI above 5x. That single filter eliminates the majority of noise before you analyze a single print.
How do you distinguish speculative flow from hedging flow?
This is where most traders make costly mistakes. A massive put purchase looks bearish on the surface. It may be a fund protecting a long equity position. Large put-buying prints can be hedges rather than bearish bets, and proper interpretation requires analyzing strike, delta, and DTE together.
Speculative flow has a recognizable profile:
-
ATM or OTM strikes with high delta sensitivity
-
Ask-side aggression (A or AA execution)
-
Sharp spikes in open interest on previously quiet strikes
-
Concentrated in individual stocks, not broad indexes
-
Short-to-medium DTE (7–45 days)
Hedging flow looks different in almost every dimension:
-
Deep ITM or far OTM strikes with low delta
-
Bid-side or mid-execution (B or neutral aggression)
-
Index options like SPX or NDX rather than single equities
-
Gradual OI buildup over days, not sudden spikes
-
Longer DTE reflecting portfolio protection timelines
Filtering out options on broad indexes like SPX or NDX is critical because these trades often represent non-directional hedging. Including them in your scan contaminates the signal with activity that carries no directional alpha.
The most reliable speculative signal combines ask-side aggression, an OTM strike on a single equity, a fresh OI spike, and a DTE under 30 days. When all four align, the probability that the trade is directional rather than protective rises substantially.
Pro Tip: Before acting on any large put print, check the delta. A deep ITM put with a delta near 1.0 on an index is almost certainly a hedge. An OTM put with a delta of 0.25 on a single stock with ask-side aggression is a different story entirely.
What patterns and timings in options order flow are most actionable?
Timing and pattern recognition determine whether flow analysis produces trades or just observations.
The morning edge is real. The first 30 minutes after market open contain the most actionable institutional flow as funds execute overnight strategies. Institutions that formed a view after the previous close act immediately at the open. The flow during this window is directionally rich and worth monitoring with full attention.
The most reliable actionable patterns, ranked by signal strength, are:
-
Accumulation: Multiple prints at the same strike and expiration within a short window signal deliberate institutional position building. A single large print could be anything. Three prints at the same strike within 20 minutes is a position.
-
Sweep clusters: Multiple sweeps on the same ticker in the same session indicate urgency that goes beyond a single desk. Cross-exchange aggression repeated across prints is a high-conviction signal.
-
Volume spike with low prior OI: New money entering a quiet strike is more meaningful than volume on a crowded strike where rolling and closing dominate.
-
DTE alignment: Prints in the 7–45 day window balance urgency with enough time for the thesis to play out. Very short DTE (under 7 days) often reflects event plays. Very long DTE (over 90 days) often reflects hedging.
A practical filter setup for actionable flow looks like this:
| Filter | Setting | Purpose |
|---|---|---|
| Premium floor | Above $175,000 | Eliminates retail noise |
| Aggression | AA or A only | Confirms buying urgency |
| Vol/OI ratio | Above 5x | Identifies fresh positioning |
| DTE range | 7–45 days | Balances urgency and time |
| Instrument type | Single equities only | Removes index hedge noise |
Pro Tip: Log every flow-based trade you take, including the aggression code, Vol/OI, DTE, and whether it was a sweep or block. After 30 trades, patterns in your own accuracy will emerge that no scanner can show you.
How does understanding options order flow improve trading strategies?
Order flow analysis does not predict price. It reveals institutional positioning and risk appetite, which is a different and more useful thing. Retail traders often mistake order flow as a price predictor. The correct frame is that flow shows where large money is positioned, not where price will go next.
That distinction changes how you use the data. Flow confirms or challenges what your technical analysis already suggests. A bullish chart setup with no supporting flow is a weaker trade. The same setup with accumulation prints at an OTM call strike is a stronger one. Flow adds a second source of evidence.
Practical applications for active traders include:
-
Breakout confirmation: Sweep clusters on OTM calls ahead of a technical breakout level suggest institutions expect the move to follow through.
-
Reversal signals: Sudden ask-side put buying on a stock in an uptrend, especially with accumulation, can signal that informed money is positioning for a turn.
-
Trend exhaustion: When a stock continues rising but flow shifts from call buying to put buying, the divergence between price and flow often precedes a correction.
-
Avoiding false signals: A single massive print without follow-through accumulation is frequently a hedge or a one-off institutional rebalance. Waiting for confirmation before entering protects against chasing noise.
Order flow analysis provides informational density not available from price charts alone. Each print encodes directional conviction, time horizon, and urgency simultaneously. Traders who learn to read that density make better decisions about which setups deserve capital and which deserve patience.
Pro Tip: Never trade a single large print in isolation. Wait for a second confirming print at the same strike before committing. The first print could be anything. The second print is a pattern.
Key Takeaways
Options order flow analysis is most effective when traders combine aggression codes, Vol/OI ratios, and accumulation patterns to identify institutional directional positioning rather than treating any single print as a trade signal.
| Point | Details |
|---|---|
| Aggression codes matter most | AA and A prints confirm bullish urgency; B and BB prints confirm bearish selling pressure. |
| Filter before you analyze | A premium floor above $175,000 and Vol/OI above 5x isolates institutional trades from retail noise. |
| Accumulation beats single prints | Multiple prints at the same strike within a short window signal deliberate position building. |
| Context separates hedges from bets | Strike, delta, DTE, and instrument type together determine whether flow is speculative or protective. |
| Timing amplifies signal quality | The first 30 minutes after market open carry the highest concentration of directional institutional flow. |
The part most traders skip entirely
Most traders who discover order flow analysis spend the first month chasing every large print they see. I did the same thing. A $500,000 sweep on a call strike feels like a gift. You buy the calls, the stock goes nowhere, and you watch the premium decay. The print was real. The interpretation was wrong.
The discipline that actually works is treating flow as a confirmation layer, not a trigger. When I see accumulation at a strike that already aligns with a technical level I respect, that combination carries weight. When I see a single massive print on a stock I have no other thesis on, I watch and wait. The flow tells me something is happening. My analysis tells me whether it is worth trading.
Combining flow with GEX and gamma regimes adds another layer of context. Dealer hedging behavior influences price pressure in ways that pure flow reading misses. A bullish sweep in a negative gamma environment hits differently than the same sweep when dealers are long gamma and dampening moves.
The traders who build real skill with order flow interpretation keep logs, review outcomes, and refine their filters over months. They do not look for a magic threshold. They build pattern recognition through repetition. That process takes time, but it compounds. After six months of logging, you will see your own edge in the data.
— OptiqTrade
How Optiqtrades helps you act on flow signals
Reading flow manually across dozens of tickers is slow and error-prone. Optiqtrades built its AI Options Strategist specifically to solve that problem. The tool filters live options flow by aggression code, premium size, Vol/OI ratio, and DTE, then applies AI evaluation to flag high-conviction setups before you would find them manually.
Every trade flagged by the Optiqtrades AI Options Strategist includes a real-time interpretation of the flow context, so you understand the signal, not just the alert. The platform is free to join, and the community of active options traders shares flow-based ideas and trade setups daily. If you want to put order flow analysis into practice without building a scanner from scratch, Optiqtrades is where to start. Visit optiqtrades.com to join the community and access live market flow data through the Market Hub.
FAQ
What is options order flow in simple terms?
Options order flow is the real-time record of every options trade executed in the market, showing size, aggression, strike, and premium. It reveals what institutional traders are doing before price confirms the move.
What does “Above Ask” mean in options flow?
“Above Ask” means the buyer paid more than the listed ask price to get filled immediately. It signals extreme bullish urgency and is one of the strongest aggression signals in order flow analysis.
How do I filter out noise in options flow?
Set a premium floor above $175,000, require a Vol/OI ratio above 5x, and exclude broad index options like SPX and NDX. This combination isolates institutional directional trades from retail and hedging activity.
What is the difference between a sweep and a block in options flow?
A sweep crosses multiple exchanges simultaneously for immediate fill, indicating urgency and high conviction. A block is a single negotiated fill, indicating planned positioning rather than time-sensitive execution.
When is options flow most reliable to trade?
The first 30 minutes after market open carry the highest concentration of directional institutional flow. Accumulation patterns, where multiple prints hit the same strike within a short window, are the most reliable signal regardless of time of day.