AI Risk Scoring for Options Traders: A Practical Guide

AI Risk Scoring for Options Traders: A Practical Guide
An AI risk score for an options trade is a numeric output, typically on a 0–100 or tiered scale, that combines a risk tier, a confidence metric, and the top input drivers behind the score. The single most important interpretation rule: never act on the score alone. Convert it to a dollar exposure cap first, then decide on position size.
TL;DR and immediate action:
- An AI risk score tells you how much capital is at risk, not just whether a trade looks “risky.”
- The NIST AI Risk Management Framework requires documented rationale for score-driven decisions, meaning every score needs a traceable evidence trail.
- The EBA’s follow-up report on ML for IRB models confirms that ML increases complexity and complicates transparency, so explainability is non-negotiable.
- Optiqtrades delivers AI-scored trade ideas with evidence trails built in, so you can act on scores with context rather than blind signals.
- Next step: Take your current risk budget, apply the score-to-exposure formula in Section 4, and cap your next position accordingly.
Table of Contents
- What an AI risk score actually measures for options trades
- How AI models produce a risk score
- What makes a risk score actionable: translating score to dollar exposure
- Checklist: how to evaluate and choose an AI risk-scoring tool
- Integrating AI risk scores into your options workflow
- Limitations, common pitfalls, and essential controls
- Worked numeric example: converting a risk score to dollar exposure
- Key Takeaways
- The score is a starting point, not a verdict
- Optiqtrades gives you scored trade ideas with the evidence trail included
- Further reading and authoritative sources
What an AI risk score actually measures for options trades
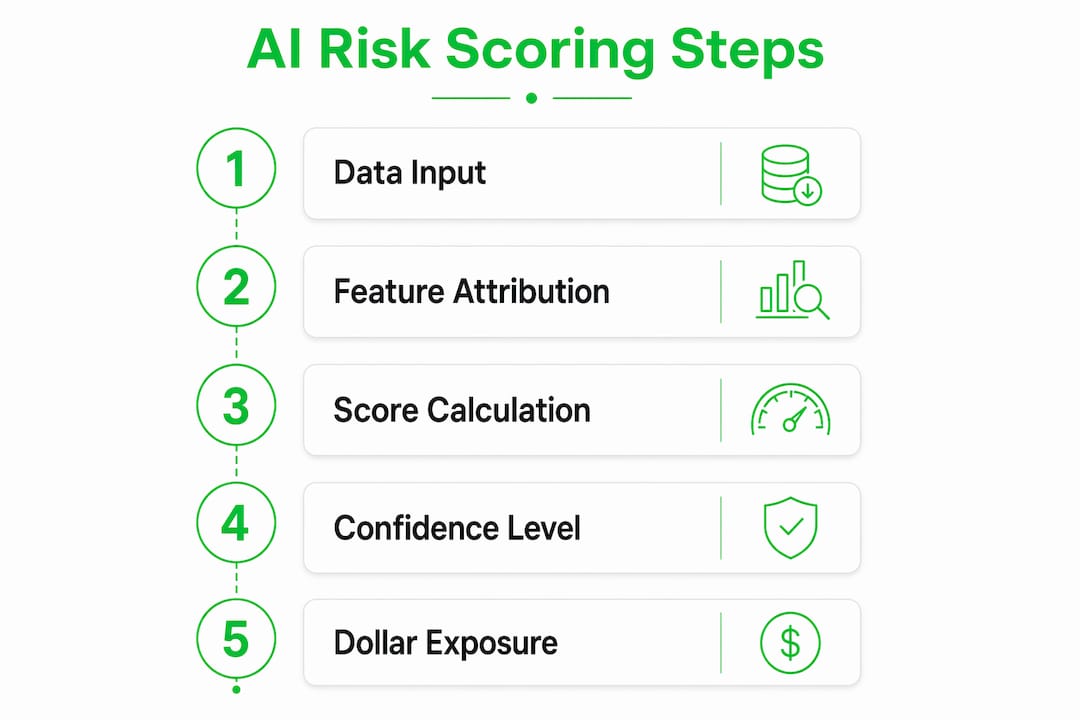
The outputs you will see from a well-built scoring system are a risk tier (low/medium/high or a 0–100 number), a calibration confidence percentage, a ranked list of feature attributions showing which inputs drove the score, and an action flag such as “reduce size” or “flag for review.”
The inputs that matter most for options are specific: underlying price and recent momentum, the Greeks (delta, vega, theta, gamma), implied volatility versus historical vol, bid/ask spread and liquidity depth, open interest, days to expiry, and event risk like earnings dates or SEC filings. Order-book signals, such as unusual options activity or large block prints, often appear as secondary features.
An evidence trail item looks like this: “Score moved from 42 to 71 because implied volatility spiked 18 points above the 30-day average (weight: 0.34), open interest dropped 22% in the last session (weight: 0.21), and time-to-expiry crossed below 7 days (weight: 0.19).” That kind of attribution is what separates a defensible score from a black box. Reproducible, rule-level evidence and an audit trail are the distinguishing features of assessments you can actually defend.
Pro Tip: Before accepting a score into your pre-trade filter, ask for three things: the top three feature attributions with weights, the backtest snapshot showing score-to-P&L over at least two market regimes, and the timestamp plus model version that produced the score.
How AI models produce a risk score
Understanding the mechanics at a practical level helps you evaluate vendor claims without needing a statistics degree. Here is what you need to know:
-
Model architecture choices matter. Gradient-boosted trees (XGBoost, LightGBM) dominate because they handle tabular financial data well and produce feature importances natively. Ensemble models combine multiple classifiers to reduce variance. Calibrated probabilistic classifiers output true probability estimates rather than raw scores. Hybrid rule-plus-ML systems layer deterministic guardrails on top of ML outputs, which is especially useful for options where hard limits on delta or DTE are non-negotiable.
-
Training and backtesting essentials. A credible model is trained across multiple market regimes, not just a bull-market window. Scenario-based testing, cross-validation across volatility regimes, and KRI-style stress scenarios isolate failure modes before the model goes live. Ask vendors for their training window, regime splits, and out-of-sample P&L impact.
-
Confidence is not reliability. A model’s confidence score measures internal consistency, not real-world accuracy. Out-of-distribution detection flags when a new trade looks nothing like the training data, which is when confidence scores become dangerously misleading. Machine learning risk assessment requires continuous evaluation to remain reliable, not a one-time backtest.
-
What to request from vendors. Training window length, the number of distinct volatility regimes covered, out-of-sample P&L attribution, and documentation of how the model handles earnings events or liquidity gaps.
What makes a risk score actionable: translating score to dollar exposure
Risk scores become actionable when translated into a dollar exposure estimate, not just a relative heatmap. The formula below gives you a position-size cap directly from the score.
Formula:
position_size = (risk_budget × score_weighted_factor) / expected_loss_per_contract
Where score_weighted_factor = (1 - normalized_score) × confidence_adjustment. A score of 70/100 with 80% confidence gives a factor of (1 - 0.70) × 0.80 = 0.24. If your risk budget is $5,000 and expected loss per contract is $200, position size caps at ($5,000 × 0.24) / $200 = 6 contracts.
| Risk Score | Confidence | Score-Weighted Factor | Max Contracts ($5K budget, $200 EL/contract) |
|---|---|---|---|
| 30 | 90% | — | 15 |
| 70 | 80% | 0.24 | 6 |
| — | 70% | — | 1 |

Validate these multipliers against backtested P&L before using them live. In high-volatility regimes, reduce the risk budget input by 20–30% to account for wider bid/ask spreads and faster score decay.
Checklist: how to evaluate and choose an AI risk-scoring tool
The single most important trust signal is an evidence trail that links score to inputs to rules or feature attributions. Everything else is secondary.
- Explainability. Can you see feature attributions for every scored trade? If not, stop evaluating.
- Backtested P&L impact. Does the vendor show score-to-P&L correlation across at least two distinct market regimes, including a high-volatility period?
- Calibration. Are confidence scores calibrated against actual outcomes, or are they raw model probabilities?
- Drift monitoring. Does the system detect performance and data drift automatically and alert you when the model needs recalibration?
- Latency and SLA. For pre-trade use, scores need to arrive in under 500ms. Confirm the SLA in writing.
- Data provenance. Where does the input data come from, how often is it refreshed, and is it timestamped?
- Governance. Are model versions logged? Is there an audit trail for score changes and human overrides?
- Integration options. API or webhook delivery for low-latency feeds into your own workflow.
Vendor questions to ask: “Show me the evidence trail for a flagged trade.” “Show me the backtest of score-to-P&L over a 12-month window that includes a volatility spike.” “How do you detect data drift, and what triggers a retraining event?”
Red flags: Black-box scores with no attribution, no out-of-sample performance data, no drift monitoring, scores that vary across reviewers with no documented reason, and no override workflow.
Pro Tip: Ask for performance verification data before committing to any scoring tool. A vendor who cannot show you a public or auditable performance record is asking you to trust a promise.
Integrating AI risk scores into your options workflow
Add scoring at two decision points: pre-trade filtering and post-fill portfolio re-check.
- Pre-trade gating. Any trade scoring above your high-risk threshold (say, 80/100) gets auto-blocked or escalated for human review before the order goes live.
- Position sizing. Apply the formula from Section 4 at the moment of order entry, using the live score and confidence from the scoring engine.
- Portfolio aggregation. Sum expected losses across open positions, run concentration checks by underlying or sector, and flag when aggregate expected loss exceeds your daily risk budget.
- Automated alerts. Trigger notifications when a position’s score changes by more than 15 points post-fill, or when the model version changes, so you can reassess open trades.
- Integration mechanics. Use API or webhook feeds tagged with model version and timestamp. Build a human-in-the-loop escalation path: high-risk flags route to a review queue, not straight to a block, so traders can override with documented rationale.
Operational targets to plan for: sub-500ms score delivery for pre-trade use, daily drift-monitoring dashboards, and a runbook that defines what triggers a scoring halt and who approves resumption.
Limitations, common pitfalls, and essential controls
AI scores are useful but incomplete. The core pitfalls are model drift, regime dependence, data gaps, and overconfidence in calibration numbers.
- Automation bias. Traders who follow scores without reading the evidence trail miss the cases where the model is extrapolating outside its training distribution.
- Tail-event blindness. Models trained on normal market conditions underweight flash crashes, liquidity crises, and earnings surprises. Validate specifically on tail events.
- Evidence trail mismatches. If the top driver listed does not match your own read of the trade, that is a signal to override, not ignore.
- Treating confidence as truth. A 90% confidence score means the model is internally consistent, not that the trade has a 90% chance of working.
Essential controls: dynamic drift monitoring with automated threshold triggers, periodic recalibration after regime shifts, scenario-based stress tests on tail events, and human override with documented rationale. Research on AI for risk analysis is clear that models struggle to represent epistemic uncertainty and can mislead without human oversight.
Compliance note: Documented evidence trails and logged overrides directly support auditability under the NIST AI RMF’s MEASURE and MANAGE components, and align with EU AI Act transparency principles for high-risk automated systems.
Worked numeric example: converting a risk score to dollar exposure
Final answer first: Given the inputs below, maximum position size is 6 contracts with an expected loss cap of $1,200.
Inputs:
- Risk score: 70/100
- Confidence: 80%
- Expected loss per contract: $200
- Risk budget: $5,000
Step-by-step:
- Normalize the score:
70 / 100 = 0.70 - Apply confidence adjustment:
(1 - 0.70) × 0.80 = 0.24 - Calculate position size:
($5,000 × 0.24) / $200 = 6 contracts - Calculate expected loss cap:
6 × $200 = $1,200
Sensitivity table (same $5K budget, $200 EL/contract):
| Score | Confidence | Contracts | Expected Loss Cap |
|---|---|---|---|
| 70 | 80% | 6 | $1,200 |
In high-volatility regimes, reduce the risk budget input to $3,500 and rerun the calculation. Validate all multipliers against at least 6 months of backtested P&L before scaling.
Key Takeaways
AI risk scoring only drives better decisions when scores are converted to dollar exposure caps and backed by a traceable evidence trail, not used as standalone signals.
| Point | Details |
|---|---|
| Convert score to dollars | Use the position-size formula: (risk_budget × score_weighted_factor) / expected_loss_per_contract. |
| Evidence trail is non-negotiable | Demand feature attributions, model version, and timestamp for every scored trade before acting. |
| Drift monitoring is ongoing | Static models fail in volatile markets; automate drift detection and recalibration triggers. |
| Human judgment stays central | AI scores support decisions; documented overrides and audit logs keep you in control and defensible. |
| Optiqtrades delivers scored trade ideas | The AI Options Strategist provides evidence trails, leaderboards, and copy-to-portfolio tools in one free platform. |
The score is a starting point, not a verdict
The trading community’s honest experience with AI risk scoring is this: the score is the beginning of the analysis, not the end. Traders who copy positions from leaderboard leaders on Optiqtrades get the most value when they can see why a trade was scored the way it was, not just that it cleared a threshold. Traceability changes the dynamic entirely. When you can see that a score jumped because implied volatility spiked and open interest collapsed, you can decide whether that signal applies to your own risk tolerance or not.
The mistake most traders make early on is treating a high-confidence score as a green light. Confidence measures internal model consistency. It says nothing about whether the market regime today matches the one the model trained on. A score produced during a low-volatility regime can look completely reasonable right up until it is not.
The practical fix is small-scale live testing before you scale any score-driven rule. Run paper trades or micro-positions for 30 days, compare the score-to-outcome relationship against the model’s claimed backtest, and only then widen the position-size cap. Shared evidence on platforms like Optiqtrades, where leaderboard traders’ track records are public and filterable by win rate and returns, makes that validation faster because you are not starting from zero.
Optiqtrades gives you scored trade ideas with the evidence trail included
Most traders who want AI-powered risk analysis face the same problem: the tools that produce scores do not show their work, and the tools that show their work are built for quants, not active options traders. Optiqtrades closes that gap directly.
The AI Options Strategist evaluates every trade idea in real time, producing a risk score, confidence metric, and the feature attributions behind it, so you can apply the position-sizing formula from this guide immediately. The community leaderboard lets you filter top traders by win rate, returns, and followers, then copy their trades directly into your own portfolio with the score context attached. Setup takes minutes, the core platform is free, and API integration options are available for traders who want to pipe scores into their own workflow. Join the community and run the AI Options Strategist on your next watchlist before you size a single position.
This article is general information for educational purposes, not financial or investment advice. Confirm current rules and suitability with a qualified professional for your own situation.
Further reading and authoritative sources
- NIST AI Risk Management Framework: The primary governance reference for evidence trails, MEASURE/MANAGE components, and auditability requirements cited throughout this guide.
- EBA Follow-Up Report on ML for IRB Models: Supervisory findings on ML transparency and traceability challenges in financial risk modeling.
- AI for Risk Analysis, PMC: Peer-reviewed review on human-in-the-loop requirements and epistemic uncertainty limits in AI risk systems.
- Risk Assessment for ML Models, ML4AD: Academic method for KRI-based scenario testing and stress validation of ML models.
- VerifyWise AI Governance Lexicon: Dynamic Risk Scoring: Best-practice guidance on drift monitoring, baseline scoring, and recalibration triggers.
- Learning About Risk: ML for Risk Assessment, ScienceDirect: Review of DNN suitability and continuous evaluation requirements for safety-critical ML applications.
- Optiqtrades AI Options Strategist: Practical entry point for options traders who want scored trade ideas with evidence trails and copy-to-portfolio functionality.