Trader Analytics: The Active Trader's Performance Guide

Trader Analytics: The Active Trader’s Performance Guide
What is trader analytics and why does it change your results?
Trader analytics is the process of converting raw brokerage data into actionable performance metrics that reveal what is actually driving your results, not what you think is driving them. Platforms in this space calculate over 75 performance metrics automatically, covering everything from win rate and profit factor to expectancy, drawdown, and R-multiples. That breadth matters because no single number tells the full story.
The core benefits break down cleanly:
- Pattern recognition: Analytics surface profitable setups and recurring mistakes that manual review misses entirely
- Behavioral feedback: Data reveals when emotional decisions like revenge trading or overtrading are costing real money
- Strategy validation: Metrics confirm whether a strategy has a genuine mathematical edge before you scale it
- Risk calibration: Drawdown and payoff data let you size positions based on math, not instinct
- Decision support: Real-time metrics shift trading from reactive to deliberate
Platforms like Tradervue and Trading Technologies Trader Analytics have made this level of analysis accessible to individual traders, not just institutional desks. The shift from spreadsheet guesswork to structured performance data is where most traders find their first real edge.
Table of Contents
- What types of analytics reports do traders actually use?
- How do you measure the metrics that actually matter?
- How AI transforms what trader analytics can do for you
- What makes Optiqtrades different for options traders?
- Why data quality determines whether your analytics mean anything
- Common pitfalls and biases that distort your performance picture
- How analytics integrate with risk management frameworks
- Practical examples of trader analytics in action
- Tools and platforms commonly used for trader analytics
- Optiqtrades gives options traders analytics and community in one place
- Key Takeaways
What types of analytics reports do traders actually use?
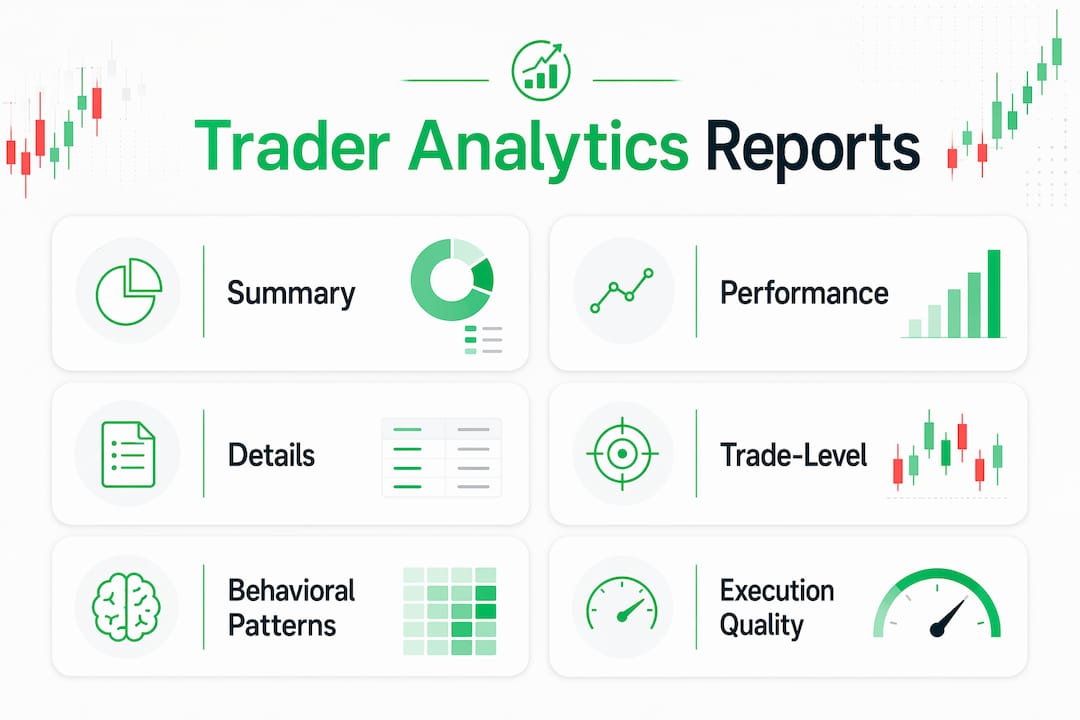
Trading analytics reports range from high-level summaries to granular execution breakdowns, and knowing which one to pull depends on what question you are trying to answer.
- Summary reports: Total P&L, win rate, profit factor, and expectancy across a defined period. Good for weekly or monthly reviews.
- Detailed trade reports: Entry, exit, hold time, fees, and slippage at the individual trade level. Essential for spotting execution drift.
- Execution quality reports: Measure how closely actual fills matched intended entries and exits. Slippage and partial fills can quietly erode net returns even when the setup was correct.
- Time-based reports: Performance filtered by time of day, day of week, or market session. Day traders often discover their edge concentrates in the first hour of the session.
- Setup and instrument reports: Break down results by trade type, ticker, or market condition to isolate what is actually working.
Platforms like Tradervue reconstruct multi-leg options trades accurately, calculating true net P&L after fees and slippage rather than estimating it. That precision matters for options traders where a spread’s actual cost basis can differ meaningfully from the headline fill price.
| Report Type | Primary Use | Key Metrics Included |
|---|---|---|
| Summary | Period performance review | Win rate, profit factor, expectancy |
| Detailed trade | Execution audit | Fill price, slippage, hold time, net P&L |
| Execution quality | Entry and exit discipline | Slippage, partial fills, timing variance |
| Time-based | Session optimization | P&L by hour, day, or market session |
| Setup/instrument | Strategy refinement | Per-setup win rate, R-multiple, expectancy |
How do you measure the metrics that actually matter?
Most traders track win rate. Few track the metrics that actually predict long-term profitability. Here is what the numbers mean and why each one earns its place in a serious review.
Win rate is the percentage of trades that close profitable. A 70% win rate sounds great until you find out the average loser is five times the size of the average winner. Win rate only becomes meaningful when paired with the next two metrics.
Profit factor divides gross profit by gross loss. A profit factor above 1.0 means winners outweigh losers in dollar terms. Below 1.0, no win rate saves you.
Expectancy combines win rate and average win/loss size into one number: the average amount you expect to make per trade. Positive expectancy over a large sample confirms a real edge. The formula: Expectancy = (Win Rate × Average Win) minus (Loss Rate × Average Loss).
R-multiples normalize every trade result by the initial risk taken. A trade that risks $200 and returns $600 is a 3R winner, regardless of account size. Tracking R-multiples removes position-size distortion from your performance picture and lets you compare trades fairly across different setups and instruments.
Maximum drawdown measures the worst peak-to-trough drop in your equity curve. It is the gut-check metric that tells you whether you could have survived your own strategy psychologically and financially.
Statistic callout: Using Sharpe and MAR ratios together gives a more complete risk picture than either alone. Sharpe penalizes return volatility; MAR focuses on the largest loss relative to annualized return. A strategy can look smooth on Sharpe and brutal on MAR, or vice versa.
Tracking both gross and net returns matters too. Commissions, swap charges, and fees can turn a marginally profitable strategy into a losing one. Net return is the only number that reflects what you actually keep.
How AI transforms what trader analytics can do for you
Static reports tell you what happened. AI tells you why, and what to do about it.
AI-powered analytics automatically tag trades by market condition, setup type, and behavioral pattern without requiring manual input. That automation alone eliminates one of the biggest gaps in traditional journaling: traders log trades inconsistently, especially after losing streaks, which corrupts the data set.

Pro Tip: Use AI behavioral detection as a coaching filter, not a report card. When the system flags revenge trading or overtrading after a loss, treat that as a rule-based trigger to reduce position size for the next session, not just an observation to note and ignore.
The behavioral detection capability is where AI earns its keep. AI pattern detection surfaces profitable setups and recurring mistakes that are invisible to manual review, including behavioral shifts like tightening stops prematurely after a losing streak or adding size after a winning run. These patterns repeat across hundreds of trades and are nearly impossible to catch without automated scanning.
The transition from static dashboards to interactive AI tools also changes how traders use their data. Instead of reviewing a report at the end of the week, traders get real-time decision support: flags when a trade deviates from their historical edge, alerts when drawdown is approaching a threshold, and setup-specific guidance based on their own trade history. Tradeweb Trading Analytics applies similar logic at the institutional level, using execution data to surface patterns across large trade volumes that no human analyst could process manually.
What makes Optiqtrades different for options traders?
Optiqtrades is built specifically for options traders, and the analytics layer reflects that focus in ways a general-purpose journal does not.
Every trade on the platform receives a real-time AI evaluation, not a post-session summary. That means you get feedback on a trade’s quality, risk profile, and alignment with your historical edge before the position has time to drift. The AI Options Strategist tool goes further by identifying behavioral patterns across your trade history and surfacing the specific habits that are costing you money.
Key platform capabilities:
- Real-time AI trade evaluations on every position, not just end-of-day summaries
- Follow and copy trades from top-ranked community traders directly into your own portfolio
- Integrated brokerage tracking that consolidates performance data across accounts in one view
- Trader leaderboards filterable by win rate, returns, and follower count so you can identify who is worth following
- Community forums where traders share setups, strategies, and post-trade analysis collaboratively
The community layer adds something most analytics platforms skip entirely: social accountability and peer learning. Seeing how a consistently profitable trader manages a position in real time teaches execution discipline faster than any report. Optiqtrades is free to start, with premium filters available for traders who want deeper analytics access. That freemium structure makes it accessible to traders at any account size.
Why data quality determines whether your analytics mean anything
The most sophisticated metrics are only as reliable as the data feeding them. Garbage in, garbage out applies to trader analytics more directly than almost any other domain.
Broker-exported data often contains inconsistencies: mismatched timestamps, missing fee fields, and incomplete fill records for complex options spreads. Automated reconstruction of execution details, including slippage and partial fills, is critical for true performance analytics. Manual spreadsheets introduce transcription errors and selection bias, where traders unconsciously log winning trades more completely than losing ones.
Multi-broker consolidation adds another layer of complexity. A trader running strategies across two or three accounts needs unified data to see aggregate drawdown, total exposure, and portfolio-level metrics. Fragmented data produces fragmented conclusions. Platforms that pull directly from broker APIs or accept standardized CSV exports from brokers like thinkorswim, IBKR, and Tastytrade eliminate most of these errors at the source. The cleaner the input, the more trustworthy the output.
Common pitfalls and biases that distort your performance picture
Even with clean data, interpretation errors are common. The most expensive one is recency bias: weighting the last two weeks of results more heavily than the full sample. A strategy that has produced positive expectancy over 300 trades does not become broken after a 10-trade losing streak, but many traders abandon it at exactly that point.
Survivorship bias shows up when traders only analyze completed strategies, ignoring the setups they abandoned mid-test. That skews the apparent success rate of everything they kept. Overfitting is the backtesting version of the same problem: a strategy tuned to perform perfectly on historical data often falls apart on live data because it was optimized for noise, not signal.
Confirmation bias is subtler. Traders who believe a setup works tend to tag their trades in ways that support that belief, categorizing bad executions as “market conditions” rather than execution errors. Automated tagging by AI removes that subjectivity from the classification process. Tracking 10 or more trading metrics including drawdown and expectancy helps traders build data-driven strategies and avoid the trap of optimizing for the one metric that flatters their current approach.
How analytics integrate with risk management frameworks
Analytics and risk management are not separate disciplines. The metrics you track directly determine how you size positions and set exposure limits.
Integrating trader analytics with risk management allows dynamic position sizing and drawdown mitigation based on real-time metrics. The core formula every trader should know: Position Size = (Risk per Trade % × Account Size) / (Entry Price minus Stop Loss Price). That formula requires accurate win rate and payoff ratio data to set the risk percentage intelligently, which is exactly what a structured analytics system provides.
Drawdown thresholds work the same way. If your analytics show that your strategy historically recovers from drawdowns up to 12% but struggles beyond that, you set a hard rule to reduce size when drawdown hits 10%. The metric becomes the trigger, not a feeling. Portfolio-level analytics add correlation monitoring: three “uncorrelated” strategies that all lose together represent concentrated risk, and only aggregate data reveals that overlap.
Practical examples of trader analytics in action
Consider a day trader who has been profitable for six months but notices returns declining. A time-based performance report reveals that trades placed after 2:00 PM EST have a negative expectancy, while morning trades remain strongly positive. The fix is simple: stop trading after 2:00 PM. Without the time-based breakdown, the trader would have kept searching for a setup problem that did not exist.
A second example involves an options trader running iron condors and vertical spreads simultaneously. Setup-specific analytics show the iron condors are producing a profit factor of 1.8 while the verticals are at 0.9. The trader eliminates the verticals, concentrates capital on the condors, and improves overall returns without changing any individual trade’s execution. The analytics did not change the strategy. They clarified which part of the strategy was actually working.
Risk managers at the portfolio level use drawdown duration data the same way. A 15% drawdown that recovers in two weeks is a rough patch. The same 15% drawdown that drags for three months signals a structural problem with the strategy’s regime sensitivity, not just a bad run of luck.
Tools and platforms commonly used for trader analytics
The right tool depends on what you trade, how you import data, and how much analysis depth you need.
Tradervue is one of the most established trade journaling platforms, with strong multi-leg trade reconstruction for options traders and detailed execution reporting. It pulls trades directly from brokers and calculates the standard performance metrics automatically.
Trading Technologies Trader Analytics targets professional and institutional traders, offering execution quality analysis, transaction cost analysis, and real-time performance monitoring across asset classes. It is built for high-volume environments where execution efficiency directly affects P&L at scale.
Tradeweb Trading Analytics focuses on fixed income and rates markets, providing institutional-grade execution data and market analysis tools for bond and derivatives traders. Its strength is in transaction cost analysis and pre-trade analytics for large block trades.
For active retail traders, platforms that combine automated metric calculation with behavioral AI detection and multi-broker import offer the most practical value. The Optiqtrades traders community adds a social layer that standalone analytics tools lack, letting traders benchmark their metrics against peers and learn from top performers in real time.
Pro Tip: Before committing to any analytics platform, verify it reconstructs multi-leg options trades accurately. A platform that treats each leg as a separate trade will produce misleading win rates and P&L figures for spread traders.
Optiqtrades gives options traders analytics and community in one place
Most analytics platforms hand you a dashboard and leave you alone with it. Optiqtrades takes a different approach: real-time AI evaluation on every trade, a community of options traders sharing live ideas, and the ability to follow and copy top performers directly into your portfolio.
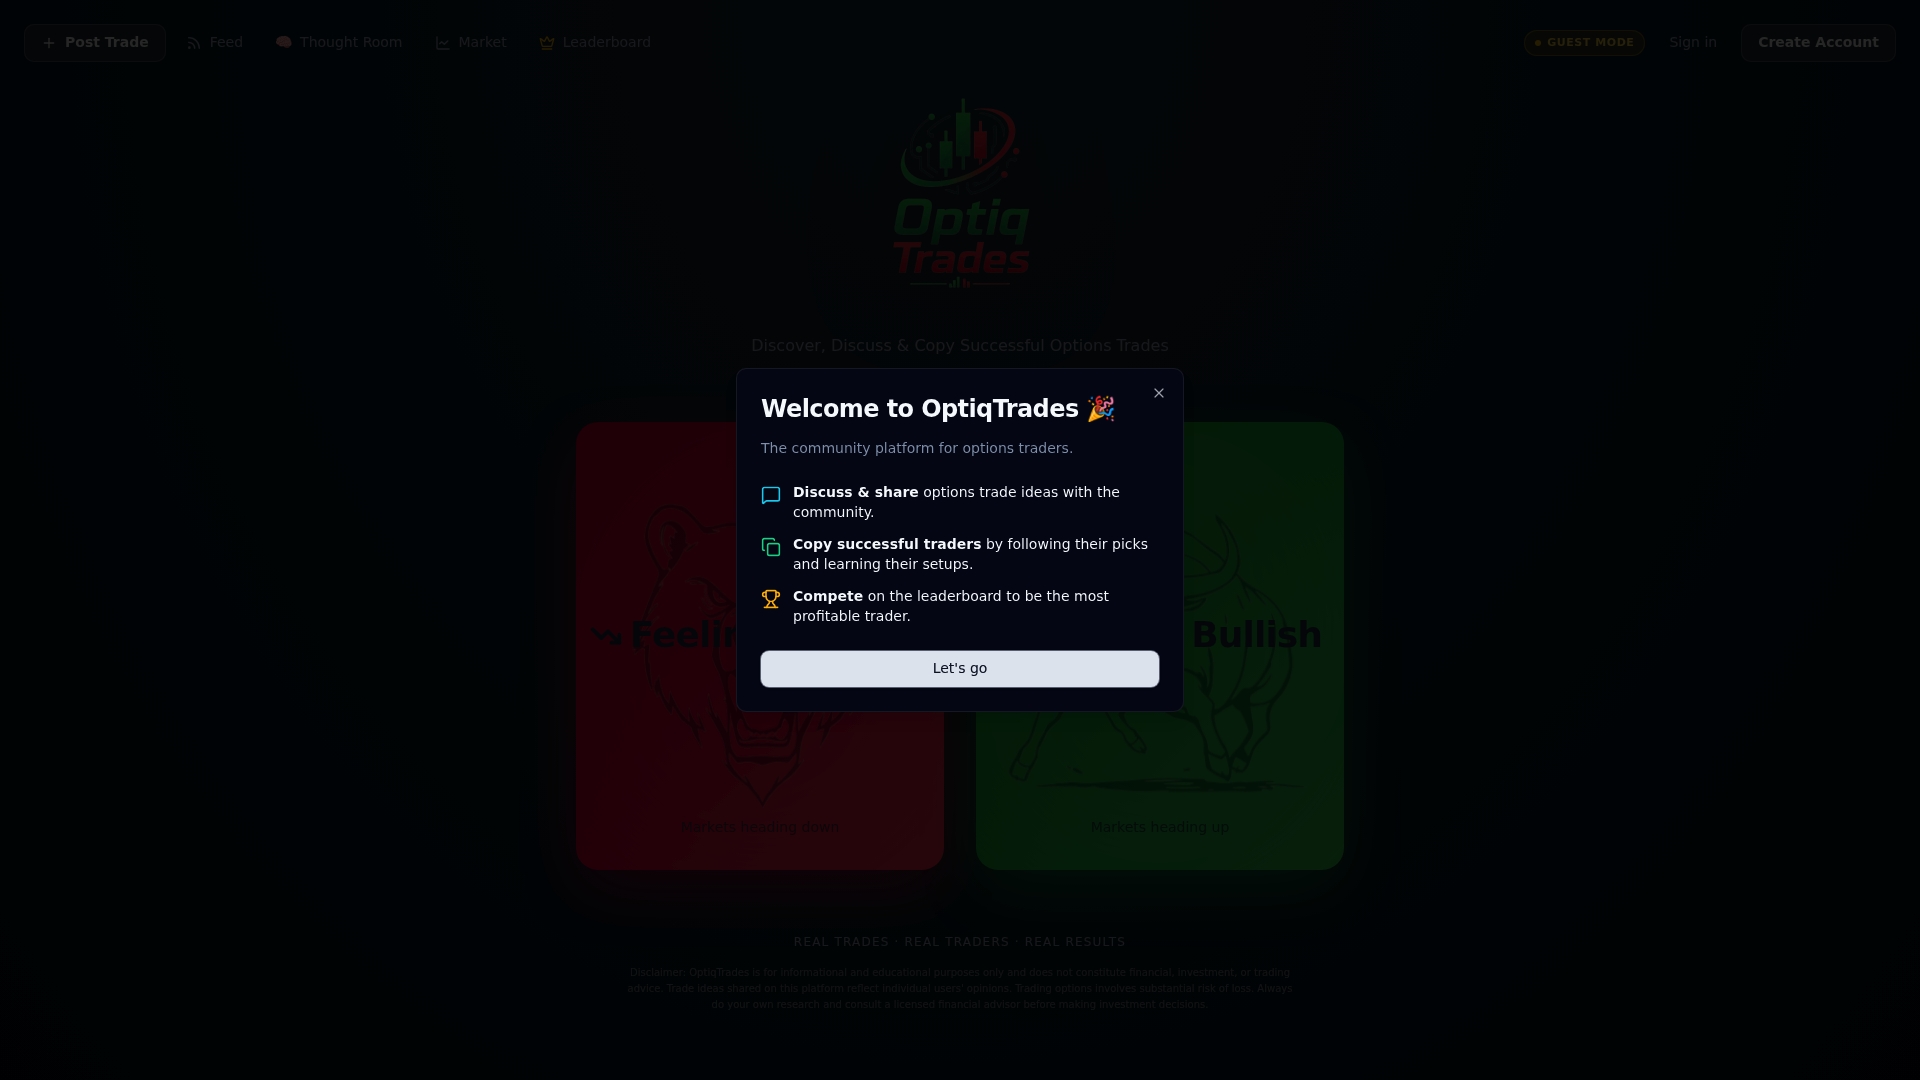
The difference for an active options trader is concrete. You get AI feedback on a trade’s quality before it has time to go wrong, not a post-mortem after the loss. The AI Options Strategist identifies the behavioral patterns in your own trade history that are costing you money, the same analysis institutional desks pay for, available free to start. If you want to see how top-ranked traders on the platform are managing their positions right now, the leaderboard and copy-trade feature put that information one click away. Sign up at Optiqtrades and connect your brokerage account to see your real performance metrics today.
Key Takeaways
Trader analytics converts raw trade data into the specific metrics that separate profitable traders from those who are simply active.
| Point | Details |
|---|---|
| Win rate alone misleads | Pair win rate with profit factor and expectancy to assess true edge. |
| R-multiples normalize performance | Measuring returns per unit of risk removes position-size distortion from your analysis. |
| AI detects what you miss | Automated behavioral tagging catches revenge trading and overtrading patterns invisible to manual review. |
| Data quality drives accuracy | Automated broker imports eliminate the transcription errors and selection bias that corrupt manual journals. |
| Optiqtrades combines analytics and community | Real-time AI trade evaluations, copy trading, and integrated brokerage tracking in one free platform for options traders. |